- Open the Models Library from the File menu.
- ファイルメニューからモデルライブラリを開く。
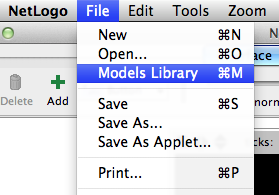
- Choose "Wolf Sheep Predation" from the Biology section and press "Open".
- BiologyセクションからWolf Sheep Predationを選択して、Openボタンを押す。
If you read the Sample Model: Party section, you got a brief introduction to what it's like to explore a NetLogo model. This section will go into more depth about the features that are available while you're exploring the models in the Models Library.
Sample Model: PartyはNetLogoの入門編です. このセクションでは、モデルライブラリーのモデルを使ってより詳しく学びます。
Throughout all of the tutorials, we'll be asking you to make predictions about what the effects of making changes to the models will be. Keep in mind that the effects are often surprising. We think these surprises are exciting and provide excellent opportunities for learning.
チュートリアルを通じて、モデルを変更するとどのような結果が予想されるか学びます。 多くの驚きがあるでしょう。その驚きはすばらしい学習の機会をもたらすことでしょう。
You may want to print out the tutorials to make them easier to refer to while you're using NetLogo.
このチュートリアルは印刷して使用することをお勧めします。
We'll open one of the Sample Models and explore it in detail. Let's try a biology model: Wolf Sheep Predation, a predator-prey population model.
サンプルモデルで詳しく見ていきましょう。 生態系モデル:狼・羊の補食、捕食者-非捕食者の人口モデルを試して見ましょう。
- Open the Models Library from the File menu.
- ファイルメニューからモデルライブラリを開く。
- Choose "Wolf Sheep Predation" from the Biology section and press "Open".
- BiologyセクションからWolf Sheep Predationを選択して、Openボタンを押す。
The Interface tab will fill up with lots of buttons, switches, sliders and monitors. These interface elements allow you to interact with the model. Buttons are blue; they set up, start, and stop the model. Sliders and switches are green; they alter model settings. Monitors and plots are beige; they display data.
インターフェースタブにはボタン、スイッチ、スライダー、モニターが並んでいます。 これらのインターフェースの要素を使ってモデルとやりとりができます。 モデルのセットアップ、スタート、ストップは青いボタン、スライダー、スイッチはグリーン、 これらの要素はモデルの設定を変更できます。 モニターとグラフはベージュでデータが表示されます。
If you'd like to make the window larger so that everything is easier to see, you can use the Zoom menu.
ウインドウの一番上のズームメニューを使うと大きく見やすくなります。
When you first open the model, you will notice that the "view" (the graphical display of the agents in the model) is empty (all black). To begin the model, you will first need to set it up.
モデルを初めて開いたときは"ビュー(View)"は空(すべて黒)で、モデルを開始するには最初に設定が必要です。
- Press the "setup" button.
- "setup"ボタンを押してください
What do you see appear in the view?
ビューに何が現れましたか?
- Press the "go" button to start the simulation.
- "go"ボタンを教えてシミュレーションを開始してください
As the model is running, what is happening to the wolf and sheep populations?
モデルが実行されると、狼と羊の頭数に変化がありましたか?
- Press the "go" button to stop the model.
- "go"ボタンでモデルと停止してください。
When a button is pressed, the model responds with an action. A button can be a "once" button, or a "forever" button. You can tell the difference between these two types of buttons by a symbol on the face of the button. Forever buttons have two arrows in the bottom right corners, like this:
ボタンが押されるとモデルが反応します。"once"ボタンと"forever"ボタンがあり foreverボタンは右下に二つの矢印が表示されていて、ボタンのシンボルでその違いが区別できます。

Once buttons don't have the arrows, like this:
Onceボタンはこのように矢印がありません。

Once buttons do one action and then stop. When the action is finished, the button pops back up.
Onceボタンは一つアクションを起こして停止します。動作が終わるとボタンが元に戻ります。
Forever buttons do an action over and over again. When you want the action to stop, press the button again. It will finish the current action, then pop back up.
Foreverボタンを押すとモデルが繰り返し動作し、もう一度押されるまで動き続けます。アクションが終了するとボタンは戻ります。
Most models, including Wolf Sheep Predation, have a once button called "setup" and a forever button called "go". Many models also have a once button called "go once" or "step once" which is like "go" except that it advances the model by one tick (time step) instead of over and over. Using a once button like this lets you watch the progress of the model more closely.
狼補食モデルを含む多くのモデルにはonceボタンと呼ばれる"setup"ボタンと foreverボタンと呼ばれる"go"ボタンがあります。 多くのモデルには"go once"や"step once"というonceボタンがあり "go"とは異なり、モデルを1ティック(タイムステップ)ずつ進めることができます。 モデルの動きを詳細に観察したいときonceボタンを使います。
Stopping a forever button is the normal way to pause or stop a model. After pausing you can make it resume by pressing the button again. (You can also stop a model with the "Halt" item on the Tools menu, but you should only do this if the model is stuck for some reason. Using "Halt" may interrupt the model in the middle of an action, and as the result the model could get confused.)
通常はForeverボタンでモデルを停止することがきます。再開するにはもう一度ボタンを押してください。 (ツールメニューの"Halt"でもモデルを止めることができますが、 モデルが何かの理由でスタックしているときに限って使用してください。 モデルの動作中に中断すると正しい結果を得られない可能性があります。)
- If you like, experiment with the "setup" and "go" buttons in the Wolf Sheep Predation model.
- 狼補食モデルで"setup"と"go"ボタンを試してみましょう。
Do you ever get different results if you run the model several times with the same settings?
同じ設定で何回か実行すると結果に違いが現れましたか?
The speed slider allows you to control the speed of a model, that is, the speed at which turtles move, patches change color, and so on.
スピードスライダーでモデルのスピードをコントロールできます。 パッチの色、タートルの動きをコントロールできます。
When you move the slider to the left the model slows down so there are longer pauses between each tick (time step). That makes it easier to see what is happening. You might even slow the model down so far as to see exactly what a single turtle is doing.
スライダーを左に動かすとモデルのスピードは遅くなり、1ティック(タイムステップ)ずつに動きます。 一つのタートルがどんな動きをしているのか見て確認することができます。
When you move the speed slider to the right the model speeds up. NetLogo will start skipping frames, that is, it won't update the view at the end of every tick, only some ticks. Updating takes time, so fewer view updates means the model progresses faster.
スピードスライダーを右に動かすとスピードが速くなります。 NetLogoはTickビューの更新をスキップしてモデルの実行を速くしています。
Note that if you push the speed slider well to the right, the view may update so infrequently that the model appears to have slowed down. It hasn't, as you can see by watching the tick counter race ahead. Only the frequency of view updates has lessened.
スピードスライダーを右にすると、ビューの更新が遅くなります。 更新の頻度が遅くなっているだけで、動作はTickのカウンターで観察することがきます。
A model's settings let you explore different scenarios or hypotheses. Altering the settings and then running the model to see how it reacts can give you a deeper understanding of the phenomena being modeled.
モデルの設定によって、異なるシナリオや仮説を探索してみましょう。 設定を変えて、その反応を見ることでモデルの現象をより深く理解することができるでしょう。
Switches and sliders give you access to a model's settings. Here are the switches and sliders in Wolf Sheep Predation:
スイッチとスライダーを使って、モデルの設定が変更できます。 狼羊補食モデルのスイッチとスライダーの例です
Let's experiment with their effect on the behavior of the model.
モデルの動作への影響を確かめてみましょう。
- Open Wolf Sheep Predation if it's not open already.
- 狼羊補食モデルを開きます。
- Press "setup" and "go" and let the model run for about 100 ticks. (The tick count is shown above the view.)
- "setup" と "go"ボタンを押して、約100ティック動かします。(ティック数はグラフの上に表示されます。)
- Stop the model by pressing the "go" button.
- "go" ボタンを押して、モデルを停止してください。
What happened to the sheep over time?
時間の経過とともに羊はどうなりましたか?
Let's take a look and see what would happen to the sheep if we change a setting.
設定を変更して、羊にどんな変化があるか観察してみましょう
- Turn the "grass?" switch on.
- "grass?"スイッチをオンにしましょう。
- Press "setup" and "go" and let the model run for a similar amount of time as before.
- "setup" と"go"ボタンを押して、前と同じ位の時間、モデルを実行してみましょう。
What did the switch do? Was the outcome the same as your previous run?
スイッチを変えるとモデルに何が起きましたか?前回と同じ結果でしたか?
Turning the "grass?" switch on affected the outcome of the model. With the switch off, the amount of grass available always stayed the same. This is not a realistic look at the predator-prey relationship; so by setting and turning on a grass regrowth rate, we were able to model all three factors: sheep, wolf and grass populations.
"grass?"スイッチをチューニングすると、モデルの結果に影響を与えます。 スイッチをオフにすると食べられる草の量は常に一定になります。 これでは捕食者-非捕食者の関係として現実的ではないので、草が再生する割合をチューニングして 狼、羊、草の3つの要素をモデル化することができます。
Another type of setting is called a slider.
スライダーによる設定変更について
Besides switches, a model may also have sliders. While a switch has only two values, on and off, a slider has a whole range of numeric values. For example, the "initial-number-sheep" slider has a minimum value of 0 and a maximum value of 250. The model could run with 0 sheep or it could run with 250 sheep, or anywhere in between. Try this out and see what happens. As you move the marker from the minimum to the maximum value, the number on the right side of the slider changes; this is the number the slider is currently set to.
スイッチの他にスライダーを使用することができます。 スイッチはオンとオフの2つの値を持ちますが、スライダーは全ての数値を設定することができます。 例えば、"initial-number-sheep(羊の初期値)"は最長値0、最大値250の値を持ちます。 羊をや0頭や250頭または任意の値でモデルを実行することができます。 次のことを試すとどうなるか試して見てください。最小値から最大値にマーカーを移動すると、 スライダーの右横の数値が変化します。表示されている数値が現在の値です。
Let's investigate Wolf Sheep Predation's sliders.
狼羊補食モデルのスライダーを調べて見ましょう。
- Change from the Interface to the Info tab to learn what each of this models' sliders represents.
- Interface(インターフェース)タブからInfo(インフォ)タブに切り替えて、 スライダーがそれぞれを何を表しているのか確認することができます。
The Info tab offers guidance and insight into the model. Within this tab you will find an explanation of the model, suggestions on things to try, and other information. You may want to read the Info tab before running a model, or you might want to just start experimenting, then look at the Info tab later.
インフォタブでモデルの中身について説明されています。 モデルを実行する前や、実験の後で内容を確認してください。
What would happen to the sheep population if there were more sheep and less wolves initially?
羊の初期値が狼よりも少ない状態でシミュレーションを開始すると 羊の数はどうなりますか?
- Turn the "grass?" switch off.
- "grass?"スイッチをオフにする
- Set the "initial-number-sheep" slider to 100.
- "initial-number-sheep"スライダーを100にする
- Set the "initial-number-wolves" slider to 20.
- "initial-number-wolves"スライダーを20にする
- Press "setup" and then "go".
- "setup"を押し、続いて"go"を押しましょう。
- Let the model run for about 100 ticks.
- 100ticks位まで実行してみましょう。
Try running the model several times with these settings.
これらの設定で何回か試してみましょう。
What happened to the sheep population?
羊の数はどうなりましたか?
Did this outcome surprise you? What other sliders or switches can be adjusted to help out the sheep population?
驚きの結果になりましたか?他のスライダーやスイッチを変えて 羊の数を増やすにはどう調整すれば良いでしょうか?
- Set "initial-number-sheep" to 80 and "initial-number-wolves" to 50. (This is close to how they were when you first opened the model.)
- "initial-number-sheep"を80に"initial-number-wolves" を50にする。(はじめに開いたモデルに近い値です。)
- Set "sheep-reproduce" to 10.0%.
- "sheep-reproduce"を10%にする。
- Press "setup" and then "go".
- "setup"を押して"go"を押す。
- Let the model run for about 100 time ticks.
- 約100ticks動かしてみましょう。
What happened to the wolves in this run?
狼の結果はどうなりましたか?
When you open a model, all the sliders and switches are on a default setting. If you open a new model or exit the program, your changed settings will not be saved, unless you choose to save them.
モデルを開くと、スライダーとスイッチにはすべて初期値が入っています。 新しいモデルを開いたり、保存せずにプログラムを終了する場合 保存を選択しない限りは、保存されません。
(Note: in addition to sliders and switches, some models have choosers and input boxes. The Wolf Sheep Predation doesn't have any of these, though.)
(注:スライダーとスイッチの他のchoosers(チューザー)やinput box(入力ボックス)を持つモデルがありますが、 狼・羊補食モデルにはありません。)
The view lets you see what's going on in a model. NetLogo also provides has other ways of giving you information about model run, such as plots and monitors.
ビューはモデルで何が起こっているか確認することができます。 Netlogoはプロットやモニターによってモデル実行時の情報を提供しています。
The plot in Wolf Sheep Predation contains three lines: sheep, wolves, and grass / 4. (The grass count is divided by four so it doesn't make the plot too tall.) The lines show what's happening in the model over time. The plot legend shows what each line indicates. In this case, it's the population counts.
狼羊補食モデルのグラフには、羊、狼、草/4、3本の線があります。 (草は数が大きいので4で割っています。) これらのグラフはモデルの経過とともに起こっていることを表しています。 プロットの凡例はそれぞれの線の内容を表しています。 このケースでは、頭数を示しています。
When a plot gets close to becoming filled up, the horizontal axis is compressed and all of the data from before gets squeezed into a smaller space. In this way, more room is made for the plot to grow.
グラフがいっぱいに近づくと、横軸が拡張し、過去のデータは圧縮して表示されます。
If you want to save the data from a plot to view or analyze it in another application, use the "Export Plot" item on the File menu. It saves the plot data in a format that can by read back by spreadsheet and database programs such as Excel. You can also export a plot by right-clicking it and choosing "Export..." from the popup menu.
グラフのデータを別のプログラムで分析するために保存したい場合は ファイルメニューで"Export Plot"を使用します。 Excelなどデータベースソフトで読めるスプレッドシート形式のフォーマットで保存されます。 右クリックでポップアップメニューから"Export..."を選択してください。
Monitors are another means of displaying information from a model. Here are the monitors in Wolf Sheep Predation:
モニターはモデルの情報を表示する機能の一つです。 これは狼羊補食モデルのモニターです。
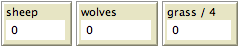
The monitors show us the population of sheep and wolves, and the amount of grass. (Remember, the amount of grass is divided by four to keep the plot from getting too tall.)
モニターは羊と狼の頭数、芝の量を表しています。 (草の量は値が大きいので4で割られていることに注意してください。)
The numbers displayed in the monitors change as the model runs, whereas the plots show you data from the whole course of the model run.
モニターに表示される値は、モデル実行時に変化し モデル実行時に得られる全てのコースのデータを表しています。
In the Interface tab, you'll see a toolbar of controls. Some of these control aspects of the view.
インターフェースタブにはコントロールのツールバーが表示されます。 いくつかのビューのコントロールを見ることができます。
Let's experiment with the effect of these controls.
コントロールによる効果を試してみましょう
- Press "setup" and then "go" to start the model running.
- "setup" の次に"go"ボタンを押すとモデルが動きます。
- As the model runs, move the speed slider to the left.
- モデルが動いたら、スピードスライダーを左に移動させます
What happens?
何が起こりましたか?
This slider is helpful if a model is running too fast for you to see what's going on in detail.
モデルの動きが速すぎて何が起こっているのか詳しく見えない時にスライダーが役に立ちます。
- Move the speed slider to the middle.
- スピードスライダーを真ん中に移動させます。
- Try moving the speed slider to the right.
- スピードスライダーを右に動かしてみましょう
- Now try checking and unchecking the "view updates" checkbox.
- "view updates"のチェックボックスを解除してみましょう。
What happens?
何が起こりましたか?
Fast forwarding the model and turning off view updates are useful if you're impatient and want a model to run faster. Fast forwarding (moving the speed slider to the right) drops view updates so the model can run fast, since updating the view takes time that could be used for running the model itself.
モデルをより高速に動かしたいときには、ビューの更新を止めることができます。 スピードスライダーを右に動かすと、更新が断続的になりモデルが速く動きます。
When view updates are off completely, the model continues to run in the background, and plots and monitors still update. But if you want to see what's happening, you need to turn view updates back on by rechecking the box. Many models run much faster when view updates are off. For others, it makes little difference.
ビューの更新をやめても、プロットおよびモニターは更新されており バックグラウンドで動き続けます。現象を確認したいときは、再びview updateの チェックボックスをオンにしてください。 更新をオフにすると多くのモデルではかなり早くなります。少しの変化しかない場合もあります。
The size of the view is determined by five separate settings: min-pxcor, max-pxcor, min-pycor, max-pycor, and patch size. Let's take a look at what happens when we change the size of the view in the "Wolf Sheep Predation" model.
ビューのサイズは次の5つの設定によって決定されます: min-pxcor, max-pxcor, min-pycor, max-pycor, 及び patch サイズです。 狼羊補食モデルのビューのサイズを変更して何が起こるか確認してみましょう。
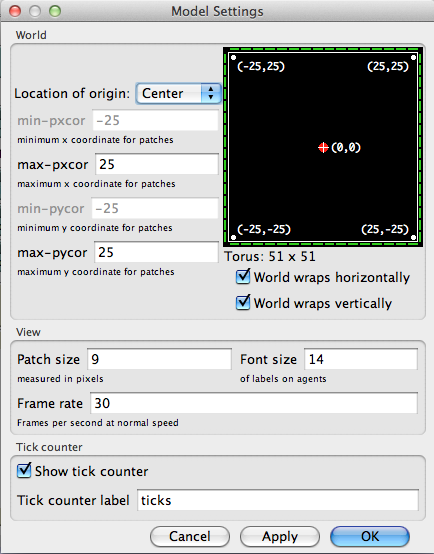
There are more model settings than there's room for in the toolbar. The "Settings..." button lets you get to the rest of the settings.
ツールバーで詳細な設定ができます。"Settings..."ボタンを押すと 別の設定が変更できます。
- Press the "Settings..." button in the toolbar.
- ツールバーの"Settings..."ボタンを押します。
A dialog will open containing all the settings for the view:
ビューに関するすべての設定がこのダイヤログボックスにあります
What are the current settings for min-pxcor, max-pxcor, min-pycor, max-pycor, and patch size?
min-pxcor, max-pxcor, min-pycor, max-pycor, patch sizeの現在の設定はどうなっていますか。
- Press "cancel" to make this window go away without changing the settings.
- "cancel"ボタンを押して設定変更をせずにウインドウを閉じます。
- Place your mouse pointer next to, but still outside of, the view.
- マウスのポインターをビューの外に置きます。
You will notice that the pointer turns into a crosshair.
マウスのポインターが十字になります。
- Hold down the mouse button and drag the crosshair over the view.
- マウスボタンを押して、ビューの上に十字をドラッグします。
The view is now selected, which you know because it is now surrounded by a gray border.
ビューがグレーの枠線で囲まれていることで選択されていることが分かります
- Drag one of the square black "handles". The handles are found on the edges and at the corners of the view.
- "handles"と呼ばれる黒い四角をドラッグしてください。ビューの角にあります。
- Unselect the view by clicking anywhere in the white background of the Interface tab.
- インターフェースタブの白い背景のどこかをクリックして選択を解除してください。
- Press the "Settings..." button again and look at the settings.
- "Settings..."ボタンを押して再度設定を確認してください。
What numbers changed?
どの数字が変わっていますか?
What numbers didn't change?
どの数字が変わっていませんか?
The NetLogo world is a two dimensional grid of "patches". Patches are the individual squares in the grid. In Wolf Sheep Predation, when the "grass?" switch is on the individual patches are easily seen, because some are green, others brown.
NetLogoはパッチというグリッドで構成される二次元の世界です。 パッチはグリッドの中にあり独立した四角です。 狼羊補食モデルでは、"grass?"スイッチをオンにすると草は緑、それ以外は茶色で 表示されることが分かります。
Think of the patches as being like square tiles in a room with a tile floor. By default, exactly in the middle of the room is a tile labeled (0,0); meaning that if the room was divided in half one way and then the other way, these two dividing lines would intersect on this tile. We now have a coordinate system that will help us locate objects within the room:
パッチは四角いタイルの床でできた部屋と同じように考えることができます。 デフォルトでは部屋の中心のタイル座標は(0,0)です。 部屋を二分すると、境界線はタイル上で交差します。 部屋の中での位置を決める座標系を持っていることになります。
How many tiles away is the (0,0) tile from the right side of the room?
(0,0)のタイルは右端から何番目にありますか?
How many tiles away is the (0,0) tile from the left side of the room?
(0,0)のタイルは左端から何番目にありますか?
In NetLogo, the number of tiles from right to left is called world-width. And the number of tiles from top to bottom is world-height. These numbers are defined by top, bottom, left and right boundaries.
NetLogoは左右のタイルの数をworld-width、上下方向をworld-heightといいます。 この値は上下左右の境界によって定義されています。
In these diagrams, max-pxcor is 3 , min-pxcor is -3, max-pycor is 2 and min-pycor is -2.
この図形のmax-pxcorは3 , min-pxcorは-3, max-pycorは2 そしてmin-pycorは-2です
When you change the patch size, the number of patches (tiles) doesn't change, the patches only get larger or smaller in the view.
パッチのサイズを変えると、パッチ(タイル)の数は変わらずに 画面上で大きくしたり小さくなったりするだけです。
Let's look at the effect of changing the minimum and maximum coordinates in the world.
座標の最大値、最小値を変えて変化を確認しましょう。
- Using the Settings dialog that is still open, change max-pxcor to 30 and max-pycor value to 10. Notice that min-pxcor and min-pycor change too. That's because by default the origin (0,0) is in the center of the world.
- 設定のダイアログを開いたままにして、max-pxcorを30、max-pycorを10に変更します。 min-pxcor、min-pycorも変化することに注意してください。 デフォルトでは世界の中心である原点は(0,0)になるためです。
What happened to the shape of the view?
ビューの形はどうなりましたか?
- Press the "setup" button.
- "setup"ボタンを押します。
Now you can see the new patches you have created.
新しいパッチができたことがわかります。
- Edit the view by pressing the "Settings..." button again.
- 再び"Settings..."ボタンを押して、ビューを編集します。
- Change the patch size to 20 and press "OK".
- パッチサイズを20に変更してOKを押します。
What happened to the size of the view? Did its shape change?
ビューのサイズはどうなりましたか?形は変わりましたか?
Editing the view also lets you change other settings. Feel free to experiment with these.
他の方法でもビューが変更可能です。自由に変えて試してみましょう。
Once you are done exploring the Wolf Sheep Predation model, you may want to take some time just to explore some of the other models available in the Models Library.
狼羊補食モデルを試したら、モデルライブラリの他のモデルも試して見ましょう
The library contains four sections: Sample Models, Curricular Models, Code Examples, and HubNet Activities.
ライブラリーは次の4つで構成されています。Sample Models, Curricular Models, Code Examples, 及び HubNet Activities.
The Sample Models section is organized by subject area and currently contains more than 200 models. We are continuously working on adding new models to it, so come visit this section at a later date to view the new additions to the library.
サンプルモデルセクションは200を超えるモデルで構成され、モデルは随時追加されています。 ライブラリに後日新しいモデルが追加されたら確認してください。
Some of the folders in Sample Models have folders inside them labeled "(unverified)". These models are complete and functional, but are still in the process of being reviewed for content, accuracy, and quality of code.
"(unverified)"とラベルがつけられたサンプルモデルのフォルダーがあります。 このモデルの機能は完全ですが、質や正確さについては検証中です。
These are models designed to be used in schools in the context of curricula developed by the CCL at Northwestern University. Some of these are models are also listed under Sample Models; others are unique to this section. See the Info tabs of the models for more information on the curricula they go with.
これらは、ノースウェスタン大学CCLによって開発されたカリキュラムのコンテキストで、 学校で使用されるように設計されたモデルです。 いくつかはサンプルモデルの下に表示されていますが、そのほかはこのセクション固有の物です。 詳細はInfo tabを参照してください。
These are simple demonstrations of particular features of NetLogo. They'll be useful to you later when you're extending existing models or building new ones. For example, if you wanted to add a histogram to your model, you'd look at "Histogram Example" to find out how.
NetLogoの簡単な機能のデモです。既存のモデルを改良したり、新たに作成する場合に役立ちます。 例えば、ヒストグラムを追加した場合は、"Histogram Example"を参考にしてください。
This section contains participatory simulations for use with groups. For more information about HubNet, see the HubNet Guide.
このセクションには特にグループで使用するシミュレーションが入っています。 詳しくは HubNet Guideを参照してください。
If you want to learn how to explore models at a deeper level, Tutorial #2: Commands will introduce you to the NetLogo modeling language.
さらに学習を深めるためにチュートリアル#2に進みましょう。 Tutorial #2: CommandsではNetLogoのモデリング言語を紹介します。
In Tutorial #3: Procedures you can learn how to alter and extend existing models and build new ones.
Tutorial #3: Proceduresでは、 モデルの拡張やモデルの新規作成のための方法を学びます。